Rat Liver Metabolism
Rat Liver Metabolism database was created by LMC within the scope of the project "Japanese Hazard Evaluation Support System for predicting repeated dose toxicity". Currently it is maintained by LMC.
Chemical Identification
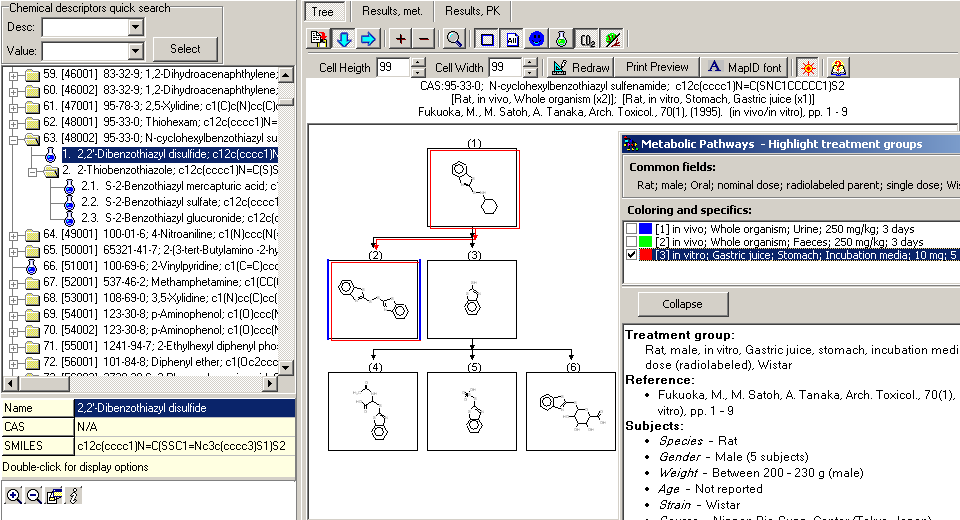
Parent chemicals are defined with CAS, SMILES, IUPAC name and chemical name(s), while metabolites are described with SMILES and chemical name(s). For each parent chemical there is a metabolic map presenting the transformations leading to occurrence of the observed metabolites. In some cases additional intermediates are introduced in order to clarify the transition of metabolites from one to the next observed level. These intermediates are marked with special flags that denote that the metabolites are not observed during the experiment. Along with metabolic transformations each map is accompanied with wide range of supporting information - test species details, experimental conditions, sampling and processing methods, dosing information, etc.
Content
The database contains 1,040 documented metabolic maps for 843 unique parent chemicals with observed biotransformation pathways of xenobiotic compounds in rat liver. Data were collected from 928 publications in scientific papers (e.g., Drug Metab. Dispos., Xenobiotica, Food Chem. Toxicol., Toxicol. Sci., Appl. Toxicol., etc.). In a few maps, where no observed data for rat was found the test organism is mouse. Every map is accompanied with rich collection of chemical, transformation and experimental data. Test variations are represented as different treatment groups (studies) that show the influence of various experimental conditions on the occurrence of each metabolite. This results in approx. 3,000 treatment groups, which can be categorized by various criteria, like by the type of study (in vivo vs. in vitro), by Phase I vs. Phase II metabolic transformations, by species (rat, human, etc.). Below are illustrated some distributions of studies:
- In vivo/in vitro - 52% in vivo, 48% in vitro
- Test organism - 97% rat, 3% mouse
- Phase I/Phase II - 83% Phase I, 40% Phase II
References
928 publications in scientific papers (e.g., Drug Metab. Dispos., Xenobiotica, Food Chem. Toxicol., Toxicol. Sci., Appl. Toxicol., etc.).
DATABASES
Rat Liver Metabolism
Click the image for a larger view
Metabolic map