CATALOGIC 301C
Endpoint
The biodegradation CATALOGIC 301C model simulates aerobic biodegradation under MITI I (OECD 301C) test conditions. The modeled endpoint is the percentage of theoretical biological oxygen demand on 28th day (BOD, %).
Data
The training set contains BOD data for 1514 chemicals under MITI I (OECD 301C) test conditions. Data for 745 chemicals were collected from the MITI I database [1] and for other 769 chemicals were provided by the NITE Japan [2]. The training set includes 418 readily biodegradable and 1096 not readily biodegradable chemicals.
Another training database of catabolic pathways for more than 550 organic compounds and expert knowledge was used to determine the principal transformations and to train the system to simulate aerobic catabolism of training chemicals. The documented pathways of microbial catabolism were collected from scientific papers, monographs and databases accessible over the Internet.
Model
CATALOGIC 301C model consists of a metabolism simulator and an endpoint model. The microbial metabolism is simulated by the rule-based approach. The core parts of the simulator are a set of hierarchically organized transformations and a system of rules that control the application of these transformations. Recursive application of the transformations allows simulation of metabolism and generation of biodegradation pathways. Calculation of the modeled endpoint (BOD, %) is based on the simulated catabolic tree and the material balance of transformations used to build the tree.
The development of the model consists of: (i) generation of metabolic maps for the training set chemicals using the microbial metabolism simulator; (ii) estimation of probabilities of occurrence of the simulator transformations. Non-linear least square fitting was used to parameterize the model:
where RSS is the residual sum of squares, BODObs and BODCalc are observed and predicted BOD data of training chemicals and P is a vector of estimated probabilities of transformations. Further details on the mathematical formalism of the model can be reviewed in [3, 4].
The model is fitted to predict percentage of theoretical biological oxygen demand on 28th day (BOD, %). Its mathematical formalism allows also prediction of half-lives and quantities of metabolites on 28th day.
Domain
The stepwise approach [5] was used to define the applicability domain of the model. It consists of the following sub-domain levels:
- General parametric requirements - includes ranges of variation of log KOW and MW,
- Structural domain - based on atom-centered fragments (ACFs),
- Domain of simulator of metabolism - determines the reliability of the simulated metabolism.
A chemical is considered In Domain if its log KOW and MW are within the specified ranges, its ACFs are presented in the training chemicals and if the simulator contains transformations for its full mineralization. The information implemented in the applicability domain is extracted from the correctly predicted training chemicals used to build the model and in this respect, the applicability domain determines practically the interpolation space of the model.
Performance
The goodness of fit evaluated by the squared coefficient of correlation and adjusted Pearson's contingency coefficient is R2 = 0.72 and C* =0.79, respectively. The model correctly classified 87% of experimentally ready and 93% of not ready degradable training chemicals.
Reporting
The model provides results for:
- BOD, %,
- Primary half-life, days,
- Ultimate half-life, days,
- Quantities of parent and biodegradation products, mol/mol parent,
- Applicability domain details.
References
1. Chemicals Inspection and Testing Institute, Biodegradation
and Bioaccumulation data of existing chemicals based on the CSCL
Japan, Chemical Industry Ecology-Toxicology & Information
Center, Japan, 1992, ISBN 4-98074-101-1.
2. NITE, Biodegradation and Bioconcentration of the Existing
Chemical Substances under the Chemical Substances Control Law, http://www.safe.nite.go.jp/english/db.html
3. S Dimitrov, T Pavlov, G Veith, O Mekenyan. SAR and QSAR
in Environ Res, 22, 2011, 699-718.
4. S Dimitrov, T Pavlov, N Dimitrova, D Georgieva, D Nedelcheva, A
Kesova, R Vasilev, O Mekenyan. SAR and QSAR in Environ Res, 22,
2011, 719-755.
5. S Dimitrov, G Dimitrova, T Pavlov, N Dimitrova, G Patlevisz, J
Niemela and O Mekenyan, J Chem Inf Model, 45, 2005, 839-849.
CATALOGIC 301C
Model features
Click the images for a larger view
BOD, %

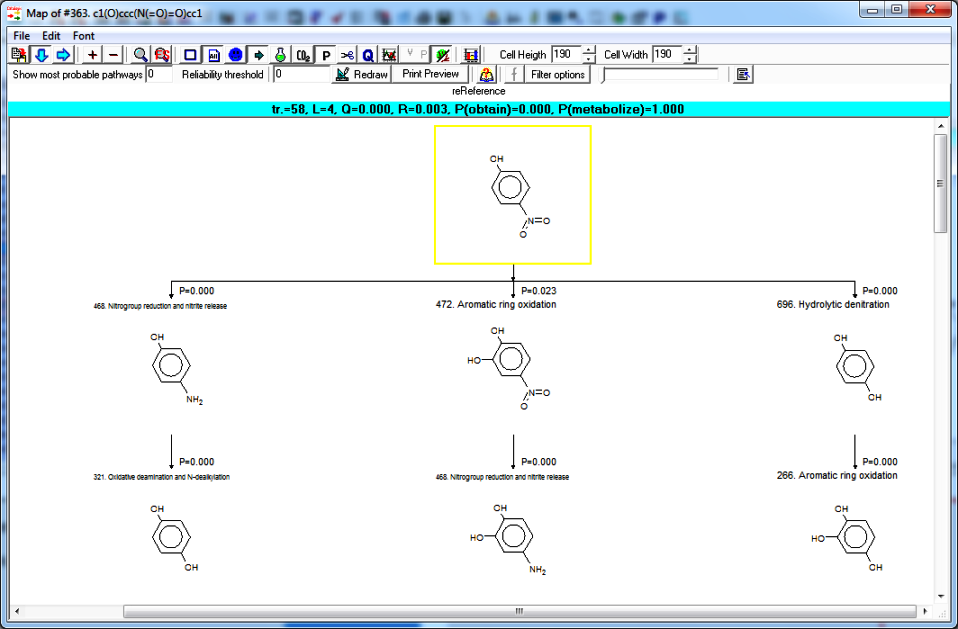
Biodegradation map
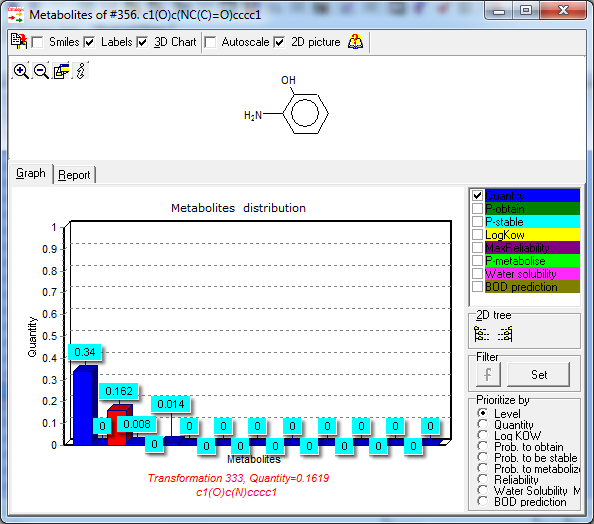
Quantity of metabolites
Model descriptions pdf