Environmental fate and ecotoxicity models
Q: What kind of results are provided by CATALOGIC biodegradation models?
A: The biodegradation models included in CATALOGIC provide results for percentage of biodegradation, primary and ultimate half-life, biodegradation map, quantity of metabolites.
Download a detailed overview of CATALOGIC model results.
-----------------------------------------------------------------------------------------------------------------
Q: Which are the parameters reported in the top bar of the CATALOGIC biodegradaton map?
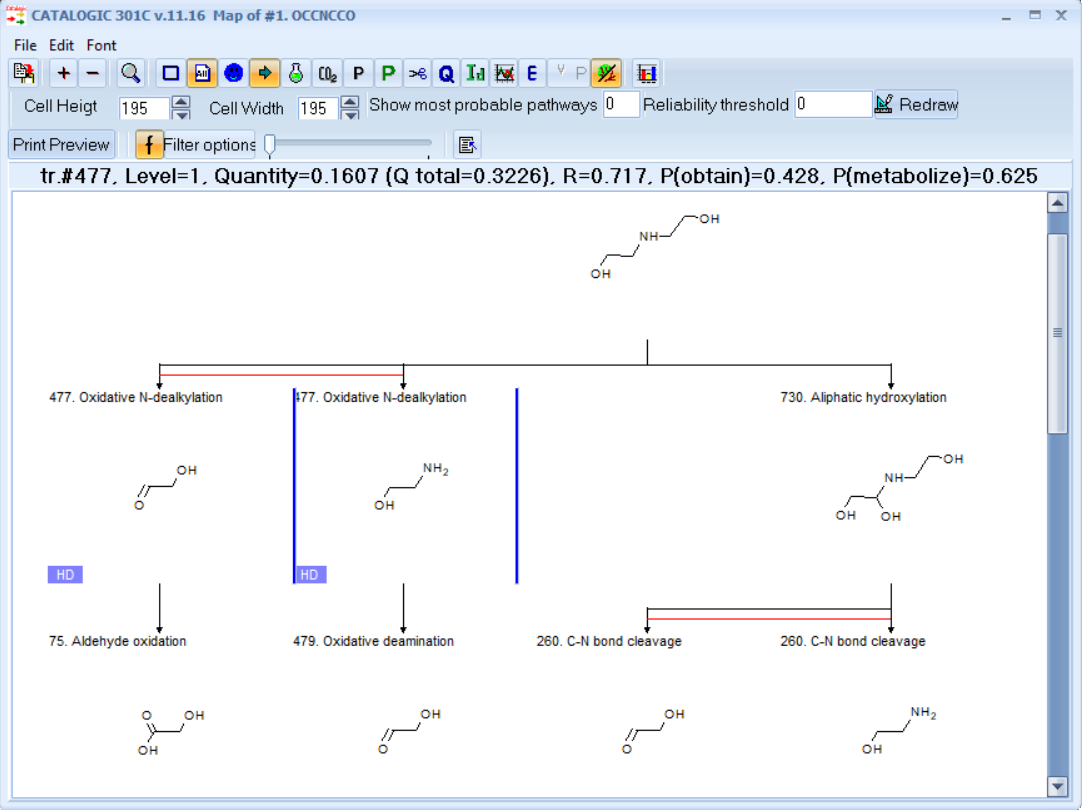
A: In the example above:
tr.=477 - The selected metabolite is generated by transformation No. 477.
Level=1 - The selected metabolite is at level 1 of the metabolism map.
Quantity=0.1607 - The individual quantity of the selected metabolite, mol/mol parent
Q total=0.3226 - The total quantity of the selected metabolite, mol/mol parent. If a specific metabolite is generated more than once in the map, then this is taken into account for estimation of the Q total.
R=0.717 - Reliability of the selected metabolite
P(obtain)=0.428 - Probability to obtain the selected metabolite
P(metabolize)=0.625 - Probability of the selected metabolite to metabolize further
-----------------------------------------------------------------------------------------------------------------
Q: The final metabolites in a biodegradation map are not CO2 and H2O, but acetate. Why?
A: CO2 and H2O are not displayed in the metabolic map (default CATALOGIC options).
In order to display CO2 and H2O select the button CO2 on the map toolbar.
-----------------------------------------------------------------------------------------------------------------
Q: What is transformation reliability?
A: The reliabilities of transformations are estimated using the database of observed biodegradation maps (displayed in the tab Observed Maps). It is defined as the ratio of successful and total (successful and non-successful) application of a transformation when the simulator is used to reproduce the available observed biodegradation maps:
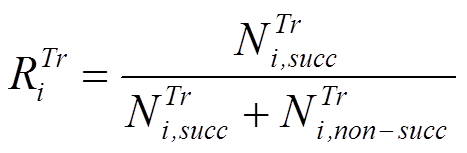
where ![]() and
and ![]() are the numbers of successful and
non-successful application of
are the numbers of successful and
non-successful application of
the ith transformation. The reliability of a transformation quantifies how well it is supported by documented biodegradation data. It should be mentioned, that the reliability should be considered only as a tentative measure because it depends on the currently available documented catabolism obtained predominantly in pure microbial culture.
-----------------------------------------------------------------------------------------------------------------
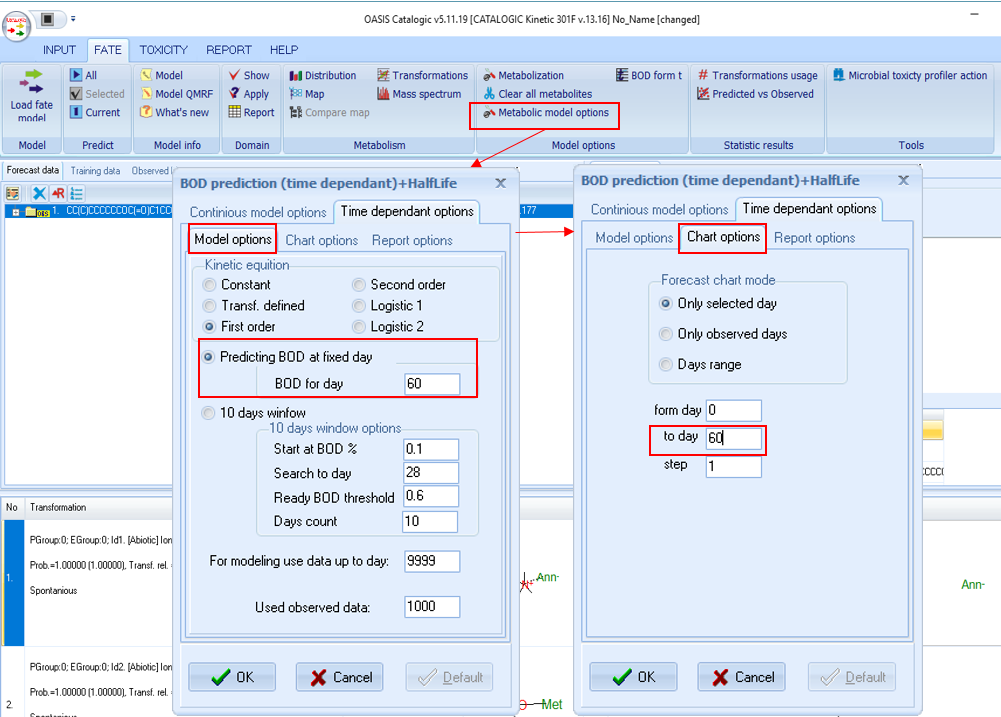
Q: How to get BOD prediction for a specific day?
A: The kinetic models available in CATALOGIC allow to get predictions for different days. Example is given with the CATALOGIC Kinetic 301F model which will be used to get BOD prediction for 60d.
------------------------------------------------------------------------------------------------------------------
Q: How to run the BCF DP model for multiple substances?
A: In order to run BCF DP model in a batch mode, two separate files with logP and logD values should be preliminary prepared using external software. Click HERE to see how to do this and how to import these files in the model (the values have been used as example only).
-------------------------------------------------------------------------------------------------------------------
Q: How the probabilities and the quantities of the metabolites are defined in the CATALOGIC software?
A: In order to see more details on how the probability/quantity of the metabolites is defined, click HERE.
-------------------------------------------------------------------------------------------------------------------
Q: What do the "<" and "*" signs mean in the prediction report?
A: The "<" (i.e. less than) sign appears in the report for toxicity prediction for the chemicals with reactive unspecified toxicity mode of action.
It is known that these chemicals possess reactive groups. However, having no enough data for their toxicity, the model predicts the upper cut-off with respect to toxicity. In other words, the base-surface toxicity model (associated with narcotic chemicals) is applied for them evaluating the max LC50 data. This is the upper boundary for LC50 which could be associated with these chemicals. Hence, no domain could be assigned for these chemicals having no sharp prediction values.
The "*" sign is a flag to attract the user attention in the cases where the predicted toxicity for a chemical is greater than the calculated water solubility (by fragment method) for this chemical.
-------------------------------------------------------------------------------------------------------------------
Q: How to dock CATALOGIC to OECD QSAR Toolbox?
A: In order to dock CATALOGIC to Toolbox, you need just to install the latest official versions of both software (i.e. CATALOGIC v.5.15.3 and QSAR Toolbox v.4.5).
Once, you have installed both on your computer, they will be automatically connected.
In this way, you will be able to 1) make a predictions within the Toolbox environment by the CATALOGIC models and 2) to use the knowledge available in Toolbox (e.g. profilers) for searching chemicals with observed experimental data points or observed metabolic maps available in CATALOGIC.