Acute Oral Toxicity
Endpoint
The acute oral toxicity model predicts the median lethal dose of a substance that causes toxic effect to 50% (LD50) of the test rodent (rat or mouse)within a designated period.
Data
The training set consists of rodent (predominantly rat) LD50 values for 1549 chemicals [1, 2]:
- Test duration - 24 hours,
- Test species - rat or mouse.
The tested chemicals belong to the following categories:
- Basal toxicity - 468 chemicals,
- Bioavailability dependant excess toxicity - 254 chemicals,
- Invariable excess toxicity - 836 chemicals.
Model
The following types of toxicity were defined:
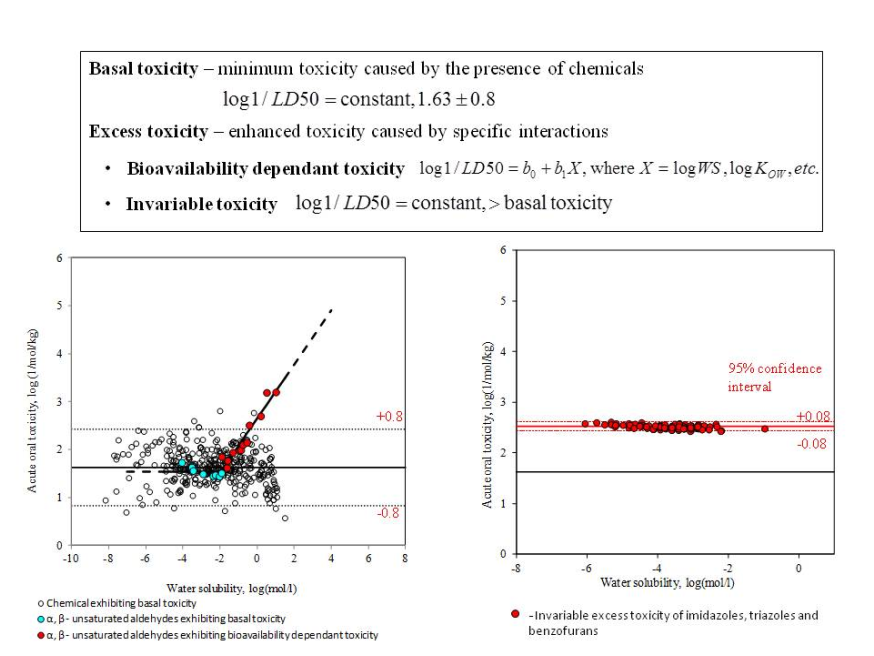
- Basal (minimum) toxicity - chemicals affect basic cell functions, which are common to all cells. In general, it is accepted that this toxicity is result of non-reactive, reversible interaction of chemicals cell membrane. Basal toxicity could be revealed also by chemicals having reactive groups but with very limited bioavailability.
- Excess toxicity - it is caused by specific interactions of chemicals destroying structures or processes which are critical for the cells or organism as a whole. Two types of excess toxicity can be distinguished:
- Invariable toxicity - it is a constant toxicity which is independent from the chemical properties,
- Bioavailability dependent toxicity - the toxicity effect of chemicals is conditioned by the bioavailability. The solubility parameters (e.g., water solubility, octanol/water partitioning, etc.) are considered adequate descriptors for bioavailability factors.
The acute oral toxicity model is based on the category approach. Chemicals are grouped in deferent classes according to their toxicological mode of action and interaction mechanism, such as affecting Na/K ATPase pump (dioxins), inhibiting vitamin K epoxide recycling (coumarins and chromenes), inhibiting the cytochrome P450 lanosterol 14 α-demethylase (imidazoles), etc. Specific models were derived for different classes of chemicals. Models for chemicals with basal toxicity or excess invariable toxicity do not include explanatory variables. Few examples of these models are presented below:
Basal toxicity: log 1 / LD50 = 1.63 ± 0.8,
Invariable toxicity of imidasoles: log 1 / LD50 = 2.52 ± 0.08,
Invariable toxicity of Na/K pump inhibitors: log 1 / LD50 = 4.8 ± 1.2,
Linear regression models were derived for chemicals with bioavailability dependent toxicity. Few examples of these models are presented below:
α,β-unsaturated aldehydes: log 1 / LD50 = 2.6 (±0.1) + 0.57(±0.1) log WS ,
Substituted coumarins: log 1 / LD50 = 1.4 (±0.2) + 0.55(±0.04) log KOW ,
N-Mustards and N-Nitrosoureas: log 1 / LD50 = 4.2 (±0.2) + 0.34(±0.1) log WS,
Organophosphates: log 1 / LD50 = 4.3 (±0.2) + 0.4(±0.1) log WS,
where WS and KOW are water solubility and 1-octanol/water partition coefficient, respectively.
Domain
The stepwise approach [3] was used to define the applicability domain of the model. It consists of the following sub-domain levels:
- General parametric requirements - includes ranges of variation log KOW and MW,
- Structural domain - based on atom-centered fragments (ACFs),
A chemical is considered In Domain if it is classified to belong to all sub-domain levels. The information implemented in the applicability domain is extracted from the correctly predicted training chemicals used to build the model and in this respect, the applicability domain determines practically the interpolation space of the model.
Statistics
The precision of the regression models is characterized by the following estimates - the 95% confidence intervals of model parameters, coefficient of determination (R2), mean squared error (estimate of error variance, s2), F value. The overall statistics is as follows:
- Coefficient of determination, R2 = 0.81,
- Mean squared error (estimate of error variance), s2 = 0.18,
- Number of chemicals, n = 1549.
It should be mentioned that the quality of models is different for different classes of toxicants. For example, the mean square error for basal toxicants is s2 = 0.16 (practically coincides with the reported in literature experimental error), while, for example, for imidazols the error is quite smaller (s2 = 0.002).
References
1. National Library of Medicine. ChemIDplus database.
2. Bundesinstitut für Risikobewertung (BfR) - ZEBET. ZEBET database on alternatives to animal experiments on the Internet (AnimAlt-ZEBET).
3. S. Dimitrov, G. Dimitrova, T. Pavlov, D. Dimitrova, G. Patlevisz, J. Niemela and O. Mekenyan, J. Chem. Inf. Model. 45 (2005) 839-849.
Acute oral toxicity
Model features
Click on the images for a larger view
Model concept
Model structure
