Estrogen binding affinity
Endpoint
Estrogenic responses to toxic chemicals could be provoked by direct binding to and activation of intracellular estrogen receptor, resulting in alteration in gene expression characteristic of endogenous estrogen exposure. The estrogen receptor binding model assesses the in vitro relative binding affinity of chemicals to the estrogen receptor.
Data
The training dataset used for deriving the model contains 1887 structurally heterogeneous chemicals. This large collection was prepared by combining data provided from CERI- Japan, US EPA and selected references from Prof. Katzelenbogen [1]. The set covers a broad range of structural classes, including steroids, diethylstilbestrol and related chemicals, flutamide derivatives, bisphenol A derivatives, alkylphenols, parabens, alkyloxyphenols, phthalates, DDTs, PCBs, and other chemicals. The experimental results for estrogen receptor (ER) binding are obtained by using test protocol for competitive binding with purified full-length human recombinant ERα and rainbow trout estrogen receptor. The ER binding affinity for each chemical is expressed as relative binding affinity (RBA), where estradiol has an affinity of 100%.
Mechanisms of estrogen binding
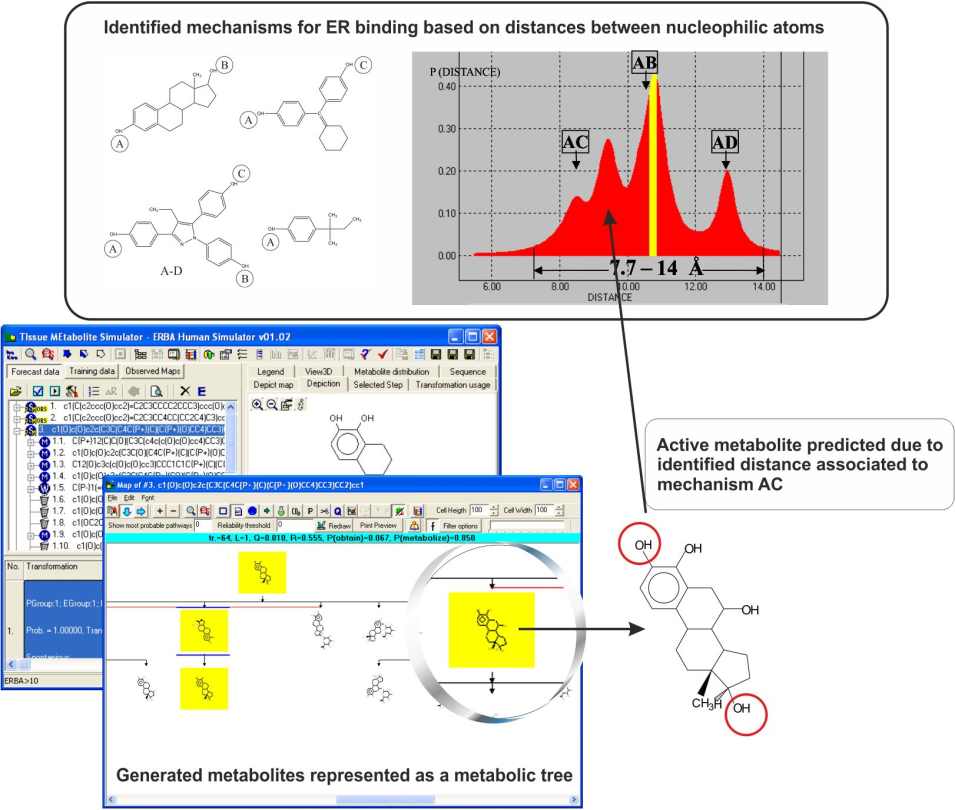
The ER binding model is based on the assumption that distances between electrophilic sites in the receptor determine the requirements for the binding mechanism [2]. Analysis of common reactivity patterns [1] of the most active estrogen binders based on the distance between electrophilic sites, resulted in identification of three distinct interaction types (Figure 1), summarized as:
- Steroid-like A-B type, modulated by steric and electronic interactions;
- A-C type, where the local hydrophobic interactions were found to be significant;
- Mixed A-B-C type, modulated by stereoelectronic parameters;
- A-type mechanism specified for phenolic chemicals with lowest estrogenic affinity
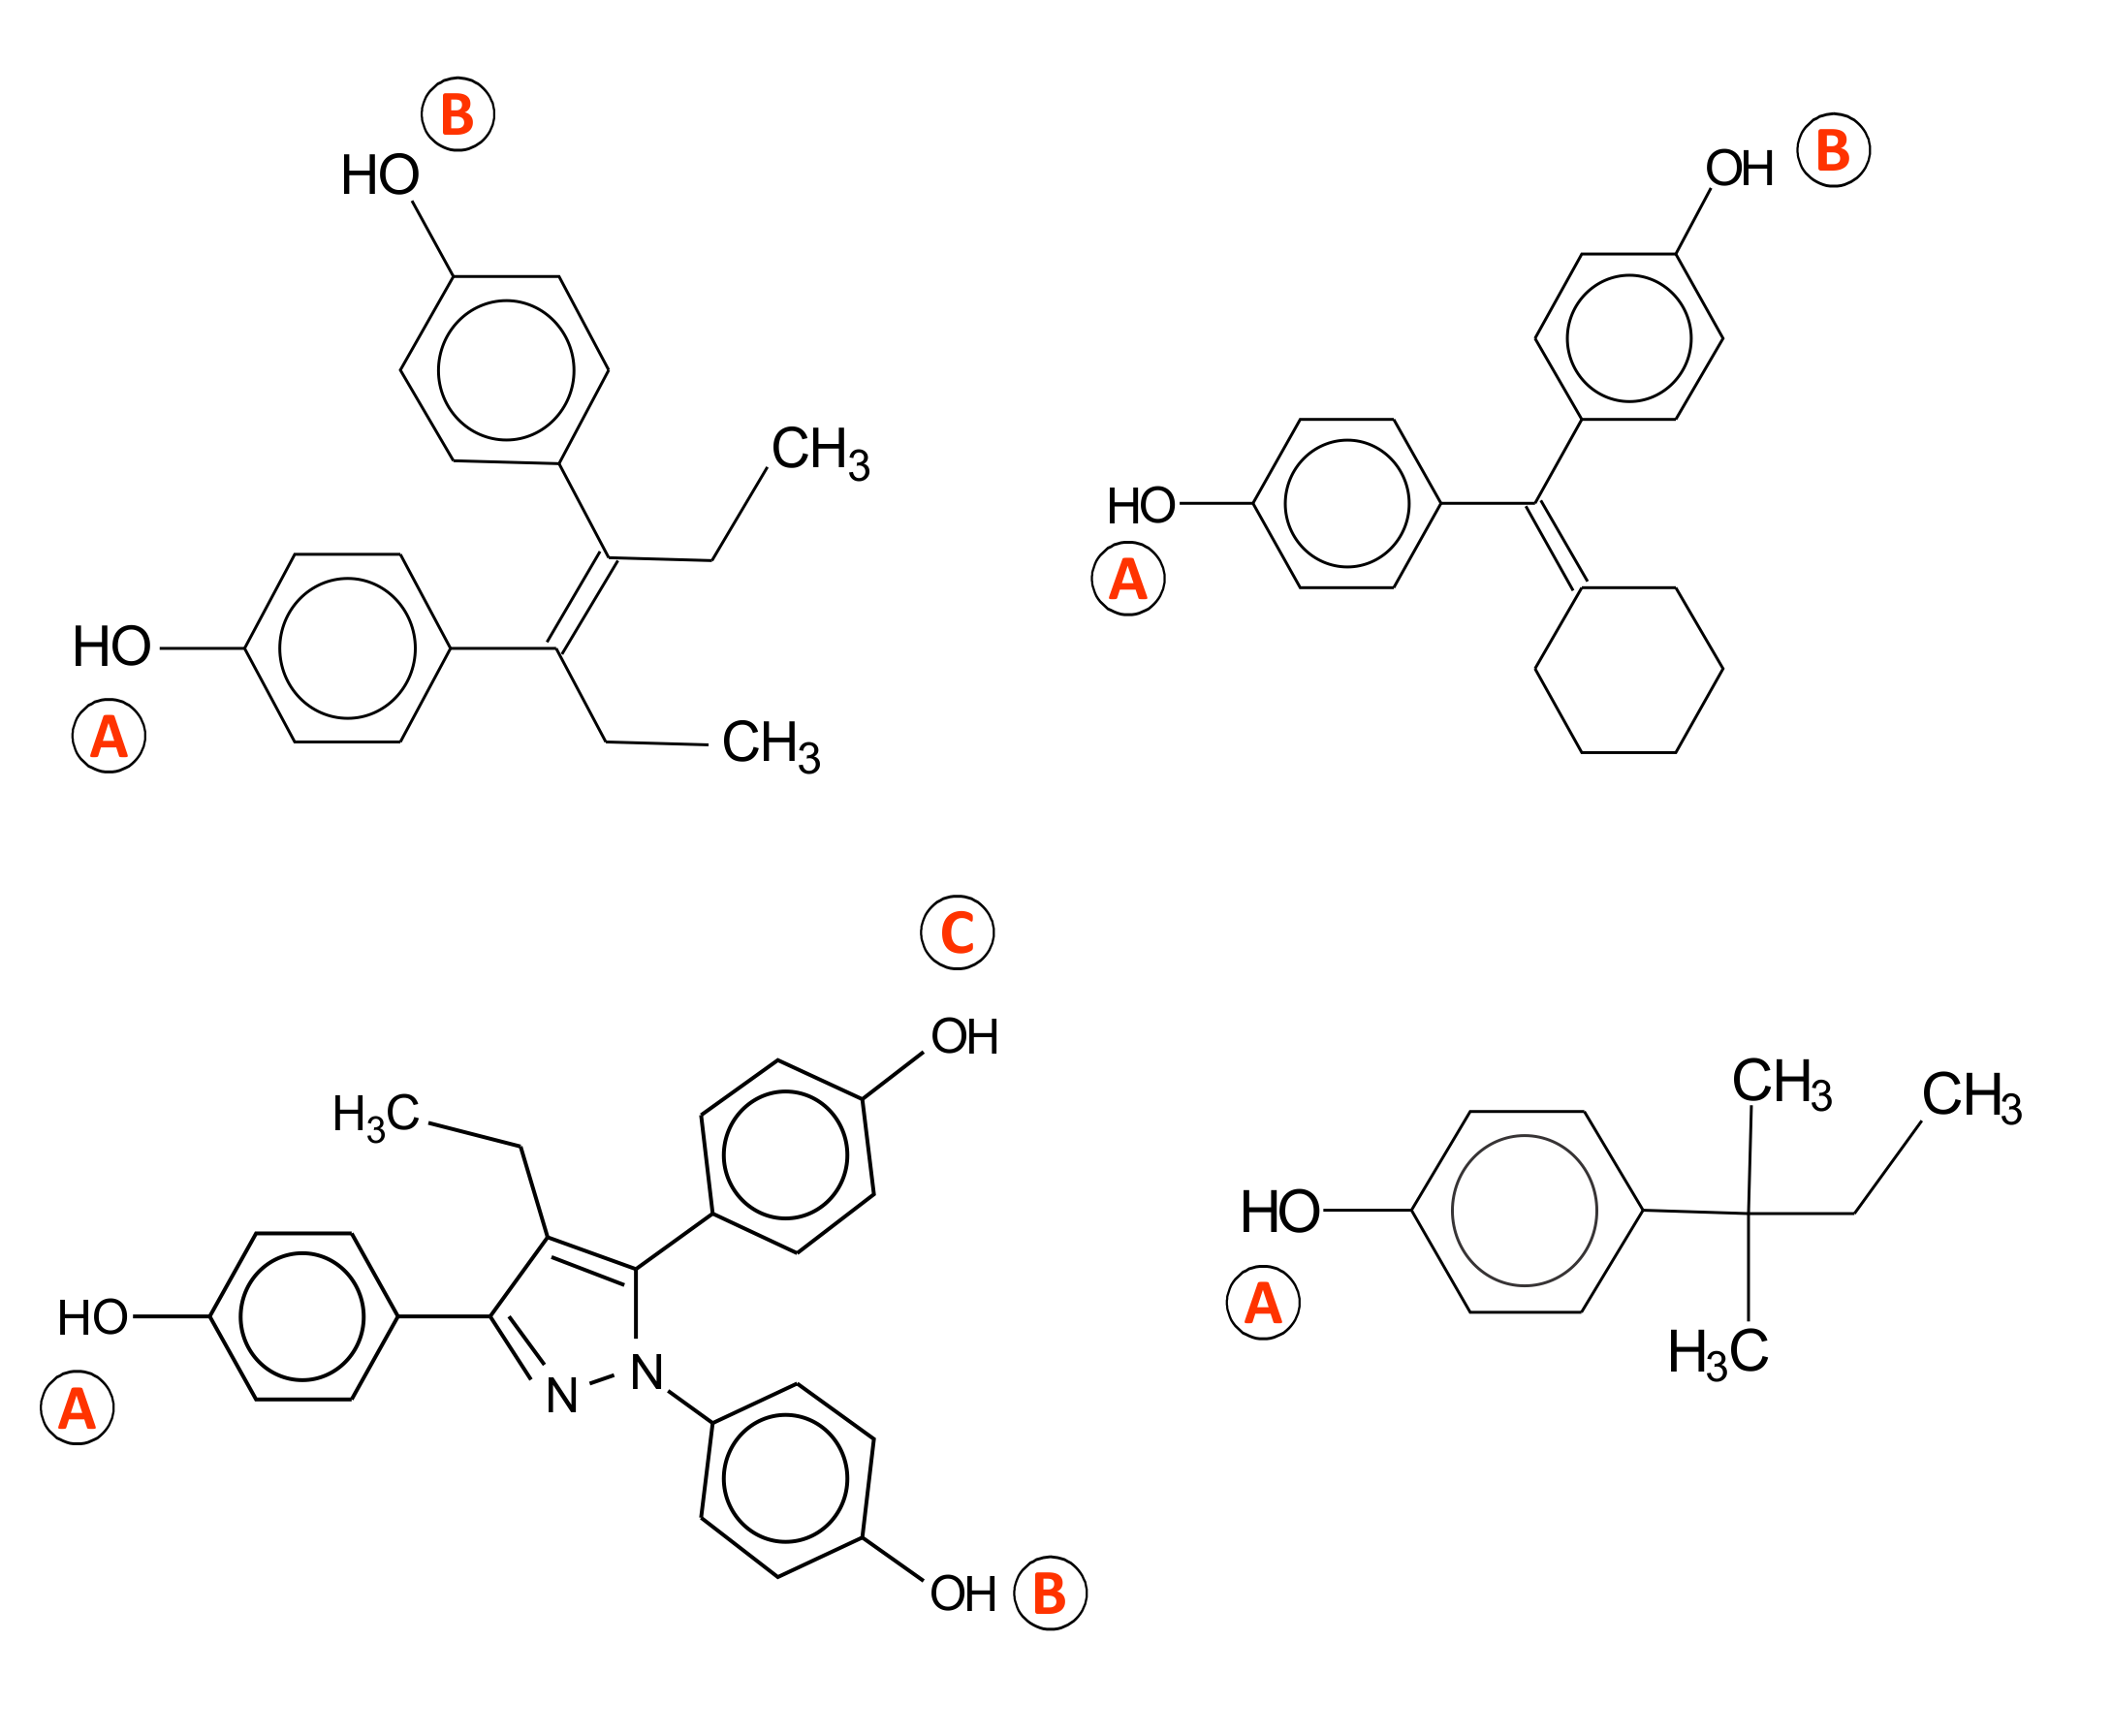
Figure 1. Mechanisms for estrogen receptor binding
For the aims of the modeling process, the training set was split into five activity ranges with respect to the RBA values. Strong ER binders (RBA > 10%), moderate (10% > RBA > 0.1%), weak binders (0.1 > RBA > 0.001), low (0.001 > RBA > 0.00001) and inactive (non binders) chemicals (RBA less than 0.001%). The model is based on categories defined by distances between electrophilic sites and additional molecular descriptors. The ultimate model is organized as a battery (Figure 2) of all categories related to the each interaction type in the respective binding affinity range [1,3].
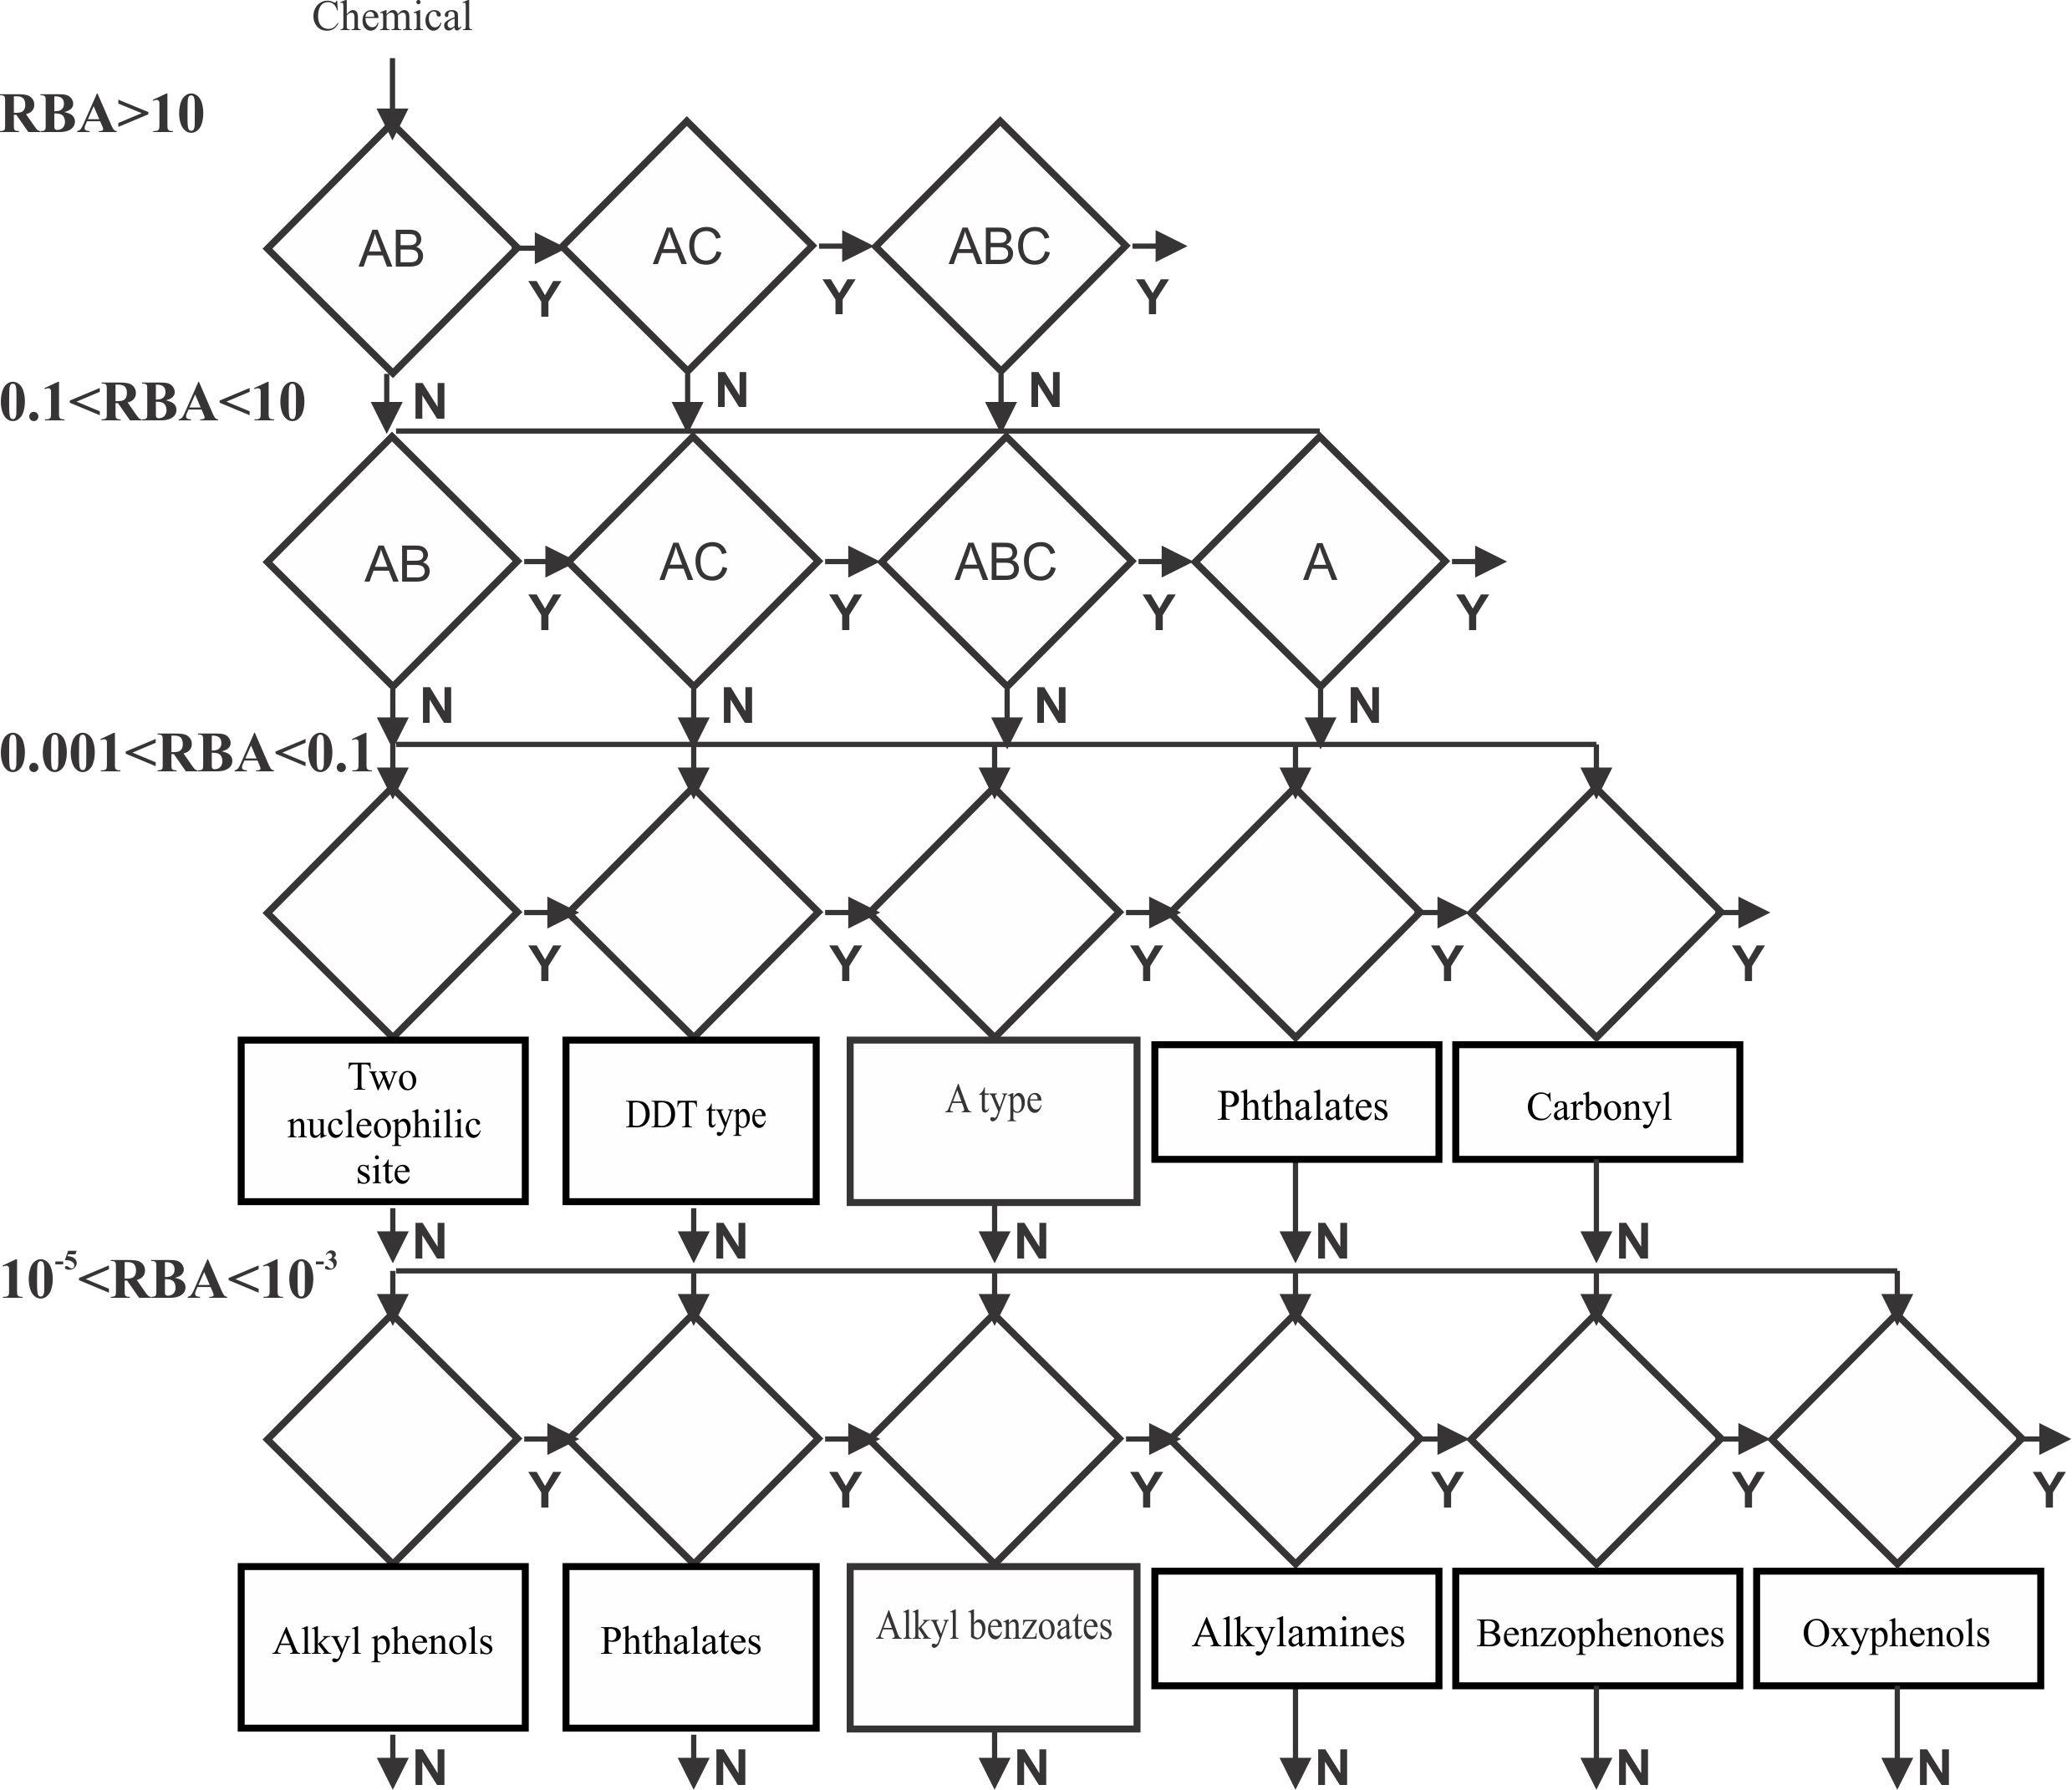
Figure 2. Structure of the ER binding model
When a chemical is submitted for prediction the requirements for strong ER binding are first applied. If the chemical does not respond to all of them, then the requirements for the lower activity bins are applied sequentially. If the chemical passes through the activity bins without meeting a binding requirement, then the ultimate prediction is not ER binder.
Performance
According to the performance of the model when applied on the training set chemicals (570 binders and 1317 non binders), correct predictions are provided for:
431 out of 554 chemicals ER binders as parents (Sensitivity = 78 %)
1203 out of 1313 chemicals non binders as parents (Specificity = 92%)
* Predictions for all chemicals which do not exceed model probability threshold are excluded
Predicting ER binding with account for metabolic activationDomain
The standard testing protocol for estrogen binding does not require metabolic activation of the tested compounds. However, there are strong evidences that variety of chemicals could possess estrogenic affect after metabolic activation (Methoxybiphenyl, Methoxychlor) [5]. Thus the role of metabolism should be accounted in order to predict the ER binding potential of metabolically activated chemicals that do not elicit activity as parent compounds.
Based on the assumption that the main organ involved in metabolism is the liver, a metabolic simulator for rat liver (S9) in vitro metabolism is implemented in the model. The S9 metabolic simulator (the same used also in Ames mutagenicity and chromosomal aberrations models) could be applied on each chemical of interest by application of hierarchically ordered (based on their feasibility of occurrence) 542 metabolic reactions:
- Phase I transformations, such as aliphatic C-oxidation, aromatic C-hydroxylation, oxidative N- and O-dealkylation, epoxidation, ester and amide hydrolysis, carbonyl group reduction, nitro group reduction, N-hydroxylation, etc.
- Phase II transformations, such as glucuronidation, sulfation, glutathione conjugation, N-acetylation, etc.
For each parent chemical all generated metabolites are submitted for predictions with the ER binding model (Figure 3). As a result the investigated chemicals could be predicted to be estrogenic as parent only, parent and metabolites, and metabolites only.
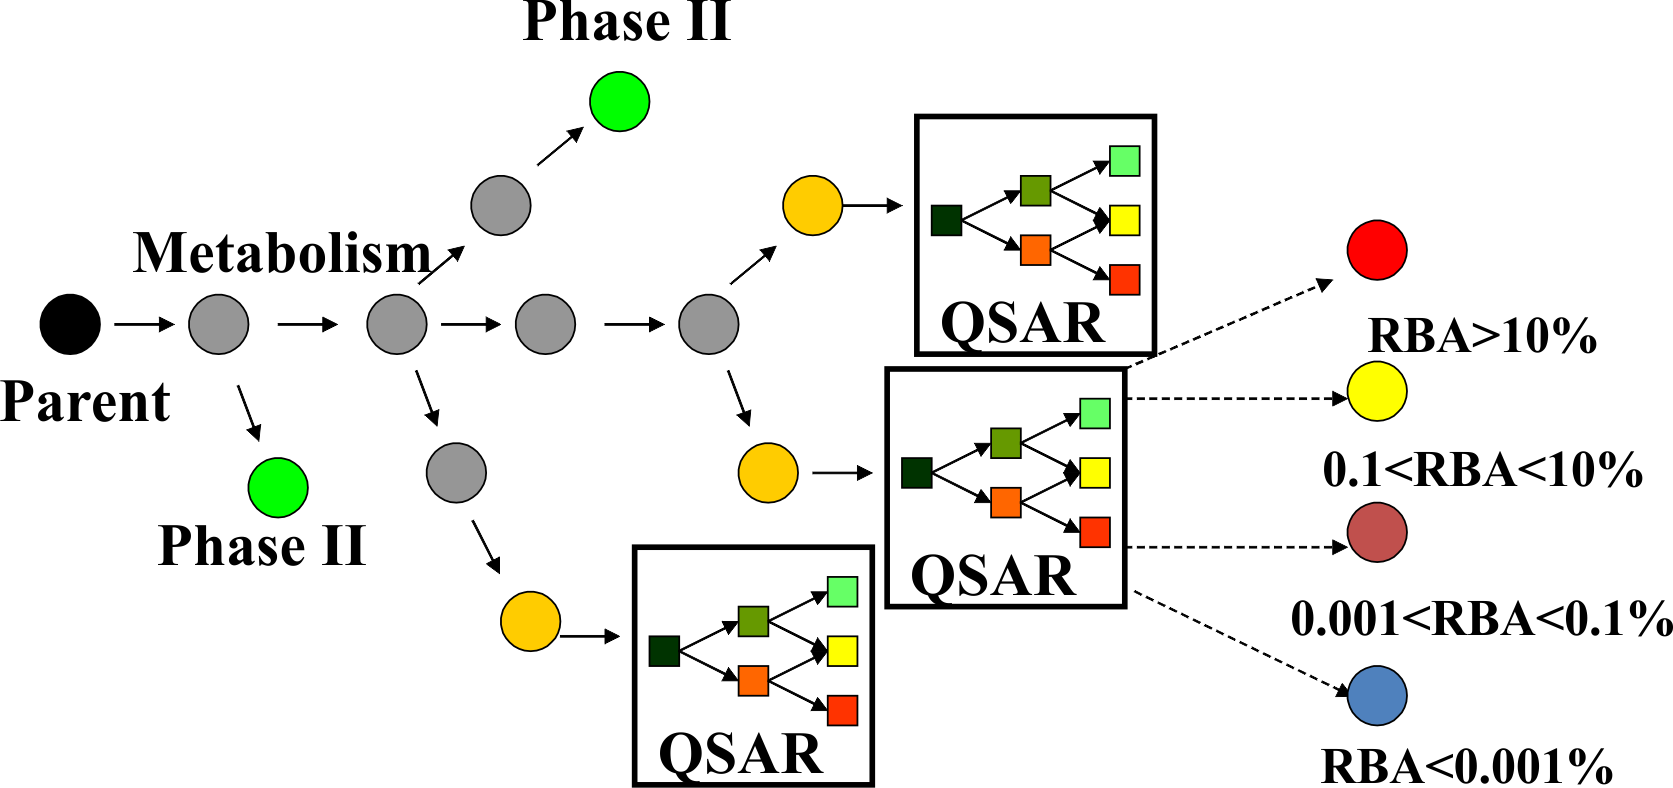
Figure 3. Metabolism in ER binding model
Because of limited experimental data for ER binding with metabolic activation, the performance of the model in combination with in vitro liver metabolic simulator was assessed by predictions made for of 25 chemicals [3]. The performance of model corresponds to 80% correct predictions.
Domain
Applicability domain of the ER binding model consists of four sub-domain layers: 1) general parametric requirements, 2) structural features, 3) interpolation space and 4) domain of metabolism simulator [4]. Two chemical subsets are used for deriving the model domains 1-3. The first subset includes the training set chemicals which are correctly predicted by the models, whereas the second subset comprises training set chemicals which are incorrectly predicted by the models.
The correct chemical subset is used for defining the general parametric requirements. Extracted are specific ranges of the molecular weight (MW) and the 1-octanol/water partition coefficient (log KOW):
• Molecular weight MW (in Da) ϵ [57; 1130],
• log KOW ϵ [-10.5; 19.2].
The atom-centered fragments extracted from the correct subset of chemicals are used to define the structural domain. Briefly, the structural domain is assessed based on atom-centered fragments, extracted from correctly and incorrectly predicted (i.e., false positives and false negatives) substances from the model training sets by accounting for the atom type, hybridization and attached H-atoms of the central atom and its first neighbours. If the neighbour is a heteroatom then the diameter of the fragment is increased up to three consecutive heteroatoms or to the first carbon atoms in sp3 hybridization. In order to assess if a new chemical belongs to the structural domain, the system partitions the chemical to atom-centered fragments, which are then matched to the fragments extracted from the correct and incorrect chemical subsets. The new chemical is estimated to belong to the structural domain only when its atom-centered fragments are found in the list of correct fragments.
Interpolation space - estimates the population density of the parametric space defined by the explanatory variables of the QSAR models by making use the training set chemicals.
Domain of the metabolic simulator - determines the reliability of the simulated metabolism.
Reporting
Predictions from the ER binding model could be reported as a tab delimited text file providing the following information for: chemical identity (CAS number, Name, SMILES), observed binding affinity (ranges), predicted binding affinity (ranges), binding mechanism, applicability domain, etc.
.
External validation of the ER binding model
The performances of the model have been externally validated by screening exercise performed by the Dow Chemical Company [6]. In this study a set of more than 1800 ToxCast™ Phase II compounds were used for evaluation of the sensitivity and specificity of the model. The sensitivity (correct predictions for binders) was found to be 75% and specificity (correct predictions for non-binders) 86% for predictions in the model domain. When the performance is assessed without accounting the domain - 60% sensitivity is reached and specificity exceeds 90%. The authors recommend the use of the model as reliable tool for identification of compounds able to bind the estrogen receptor.
References
- R. Serafimova, M. Todorov, D. Nedelcheva, T. Pavlov, Y. Akahori, M. Nakai, and O. Mekenyan. QSAR and mechanistic interpretation of estrogen receptor binding, SAR QSAR Environ. Res. 18, (2007), pp. 1-33
- J. Katzenellenbogen, Effectiveness of QSAR for prescreening of endocrine disruptor hazard, SCOPE/IUPAC International Symposium on Endocrine Active Substances, Yokohama, Japan, 2002.
- O. Mekenyan and R. Serafimova. Mechanism-Based Modeling of Estrogen Receptor Binding Affinity A COREPA Implementation. CRC Press, (2009), pp. 259-293
- S. Dimitrov, G. Dimitrova, T. Pavlov, N. Dimitrova, G. Patlevisz, J. Niemela and O. Mekenyan, J. Chem. Inf. Model. 45 (2005), pp. 839-849.
- Gaido, K.W., Leonard, L.S., Maness, S.C., Hall, J.M., McDonnell, D.P., Saville, B & Safe, S. (1999). Differential interaction of the methoxychlor metabolite 2,2-Bis-(phydroxyphenyl)- 1,1,1-trichloroethane with estrogen receptors α and β. Endocrinology 140, 5746-5753.
- B. Bhhatarai, D. M. Wilson, P. S. Price, S. Marty, A. K. Parks, and E. Carney Evaluation of OASIS QSAR Models Using ToxCast™ in Vitro Estrogen and Androgen Receptor Binding Data and Application in an Integrated Endocrine Screening Approach.. Environ Health Perspect. 2016, 12, 9, 1453-1463