Skin sensitization
Endpoint
The Skin Sensitization (SS) model [1, 2] predicts skin sensitization in a unified categorical scale for rodents. It was developed by the Laboratory of Mathematical Chemistry using funding and data from a Consortium comprising Industry (ExxonMobil, P&G, Unilever, L'Oreal, Dow Chemicals, DuPont, Givaudan and RIFM) and a Regulatory Agency (DK-EPA).
Data
The current skin sensitization model was developed using a dataset of 875 chemicals tested by Local Lymph Node Assay (LLNA) [3], Guinea Pig Maximization Test (GPMT) [4, 5] and chemicals from the BfR list [6, 7]. Part of LLNA data were provided by Unilever, Procter & Gamble, Givaudan and RIFM.
A unifying scale was derived through evaluating the correlation and concordance of those chemicals that existed in all three datasets:
|
Unified skin sensitization scale |
LLNA [8] |
GPMT [9] |
BfR [7] |
|
Strong |
Extreme, Strong & Moderate |
Strong & Moderate |
Category A |
|
Weak |
Weak |
Weak |
Category B |
|
Non |
Non* |
Non |
Category C |
* Based on suggestion of the Skin Sensitization Consortium coordinating the development of TIMES SS model the threshold for non sensitizers in LLNA was set to EC3 = 50%.
The distribution of training set chemicals having skin
sensitization experimental data among the sensitization classes are
as follows:
• 401 are Strong skin sensitizers
• 193 are Weak skin sensitizers
• 281 are Non skin sensitizers
Model
The skin sensitization model integrates a simulator of skin
metabolism together with a number of "local" QSAR models for
assessing the reactivity of specific alerts. The model was
implemented in TIMES system that allows in the same platform to be
predicted metabolism of chemicals and toxicity resulting from their
metabolic activation.
Because of the paucity of reported skin metabolism data, initially
the simulator transformations were developed based on empirical and
theoretical knowledge. The transformation probabilities
(defining the priority of their execution) were parameterized to
reproduce skin sensitization data. Currently, the simulator
was upgraded and adjusted to simulate the documented in vitro
metabolism of 151 chemicals. The simulator comprises 420
transformations, which can be divided into four main types:
• abiotic transformations
• covalent interaction with proteins
• Phase I and
• Phase II reactions.
Interactions with skin proteins are grouped into three types: significant, weak, and interactions requiring QSAR models to quantify the potency of sensitization of the alerting groups. The QSAR models were developed by the COmmon PAttern Recognition (COREPA) approach [10].
The assessment of the skin sensitization potency of a compound starts with matching the parent molecule against the list of 420 hierarchical transformations. For all the matches identified, the reactive or metabolic species and their respective protein (or Phase II) adducts are then generated. The propagation of metabolism is stopped when protein conjugation reactions classifying the chemical as strong (or weak) sensitizer or Phase II reactions are applied. For some reactive species, additional information is required and 3D-QSARs are invoked to determine their sensitization effect. The logic of the skin sensitization model is illustrated in Figure 1.
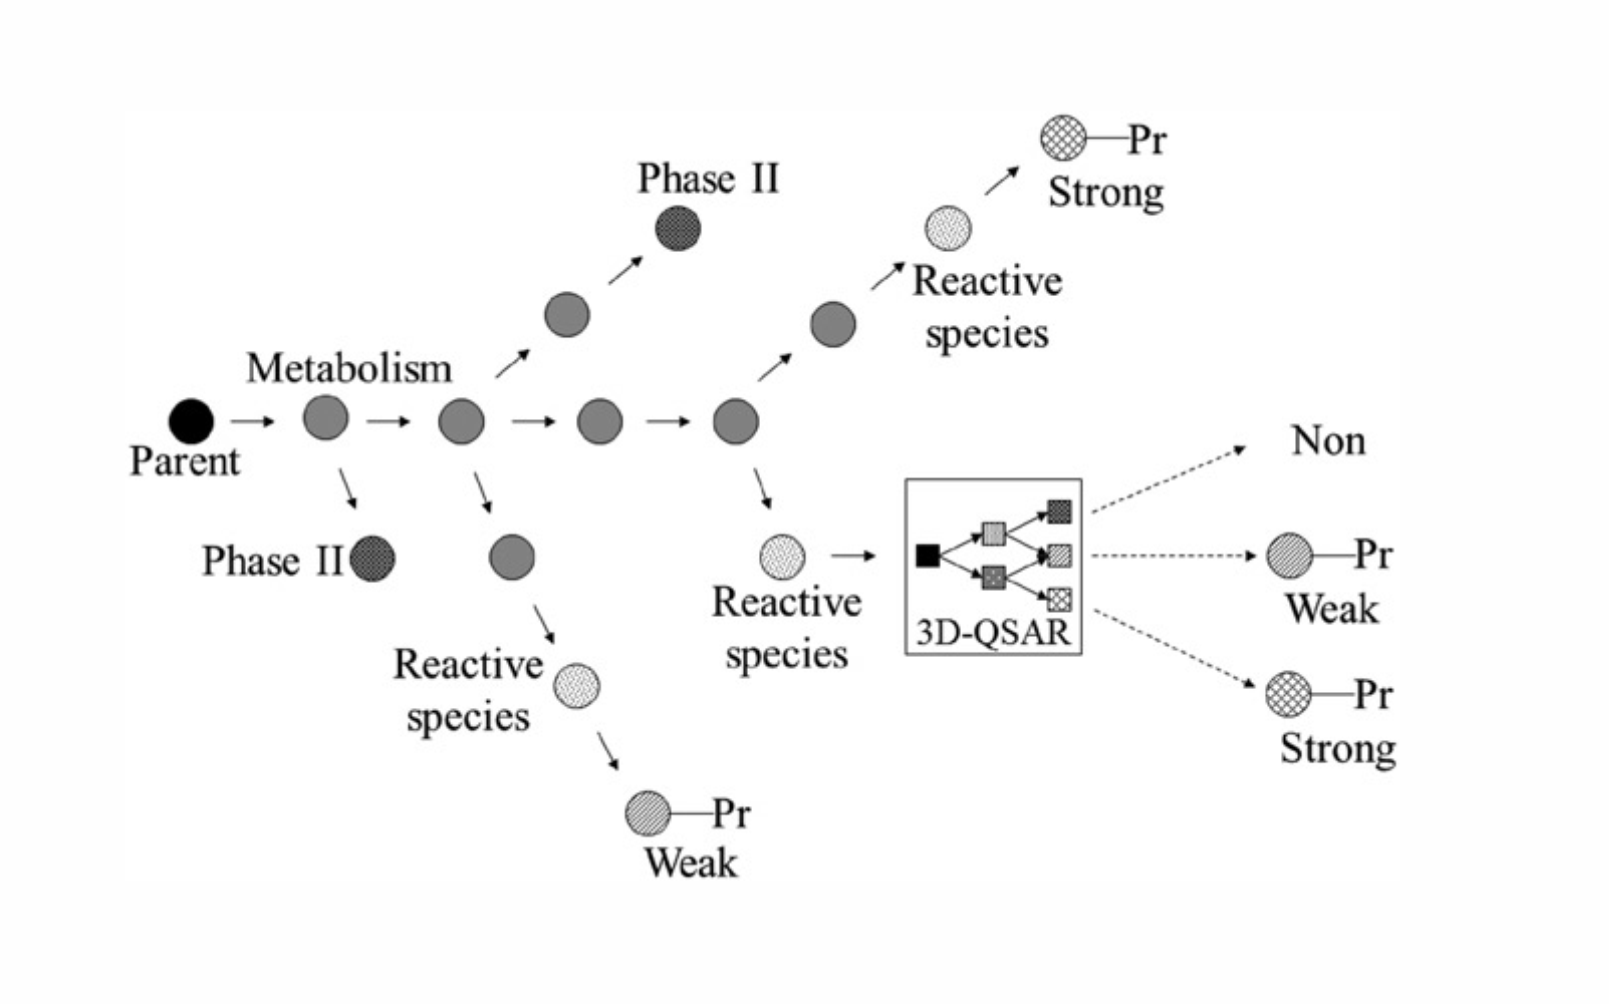
Figure 1. Illustration of different interconnections between simulator of skin metabolism and 3D-QSAR models.
The skin sensitization model predicts skin sensitization effect in three classes: strong, weak and non-sensitizers.
Domain
The stepwise approach [11] was used to define the applicability domain of the model. It consists of the following sub-domain levels:
• General parametric requirements - includes ranges of
variation log KOW and MW,
• Structural domain - based on atom-centered fragments
(ACFs),
• Mechanistic domain includes the following component:
• Interpolation space - estimates the population density of
the parametric space defined by the explanatory variables of the
QSAR models by making use the training set chemicals.
A chemical is considered In Domain if it is classified to belong to all sub-domain levels. The information implemented in the applicability domain is extracted from the correctly predicted training chemicals used to build the model and in this respect, the applicability domain determines practically the interpolation space of the model.
Performance
For 875 chemicals, an overall performance of the Skin sensitization model was 78%. The model was able to predict correctly:
• 90% of the strong sensitizers,
• 55% of the weak sensitizers and
• 77% of the non-sensitizers.
Comments on TIMES SS model performance
The low performance for Weak sensitizers could be explained with:
Variation of experimental error for LLNA, GPMT and other tests. In our recent paper with L'Oréal [12] we have analyzed the variation of in vivo LLNA data. The results showed that the variation of 95% confidence interval is a function of EC3 values. There is a well-defined linear relationship between the magnitude of the confidence interval (i.e. ΔEC3) and EC3 in the range of EC3 from 0% to 4.9%, followed by a region for EC3 values from 4.9% to 20% where the confidence interval oscillates around a constant value. From 20% onwards no relation can be drawn with our data. At high EC3 values ∆EC3 is becoming quite large and difficult to estimate due to the lack of multiple test data of a chemical at that range of EC3 values. In the paper were determined "gray zones" (fig.2) for all the EC3 thresholds according to the classification scheme suggested by Kimber et al. [13]:
• EC3 threshold 0.1% [ 0.063; 0.250 )
• EC3 threshold 1.0% [0.625; 2.500 )
• EC3 threshold 10.0% [6.400; 13.600)
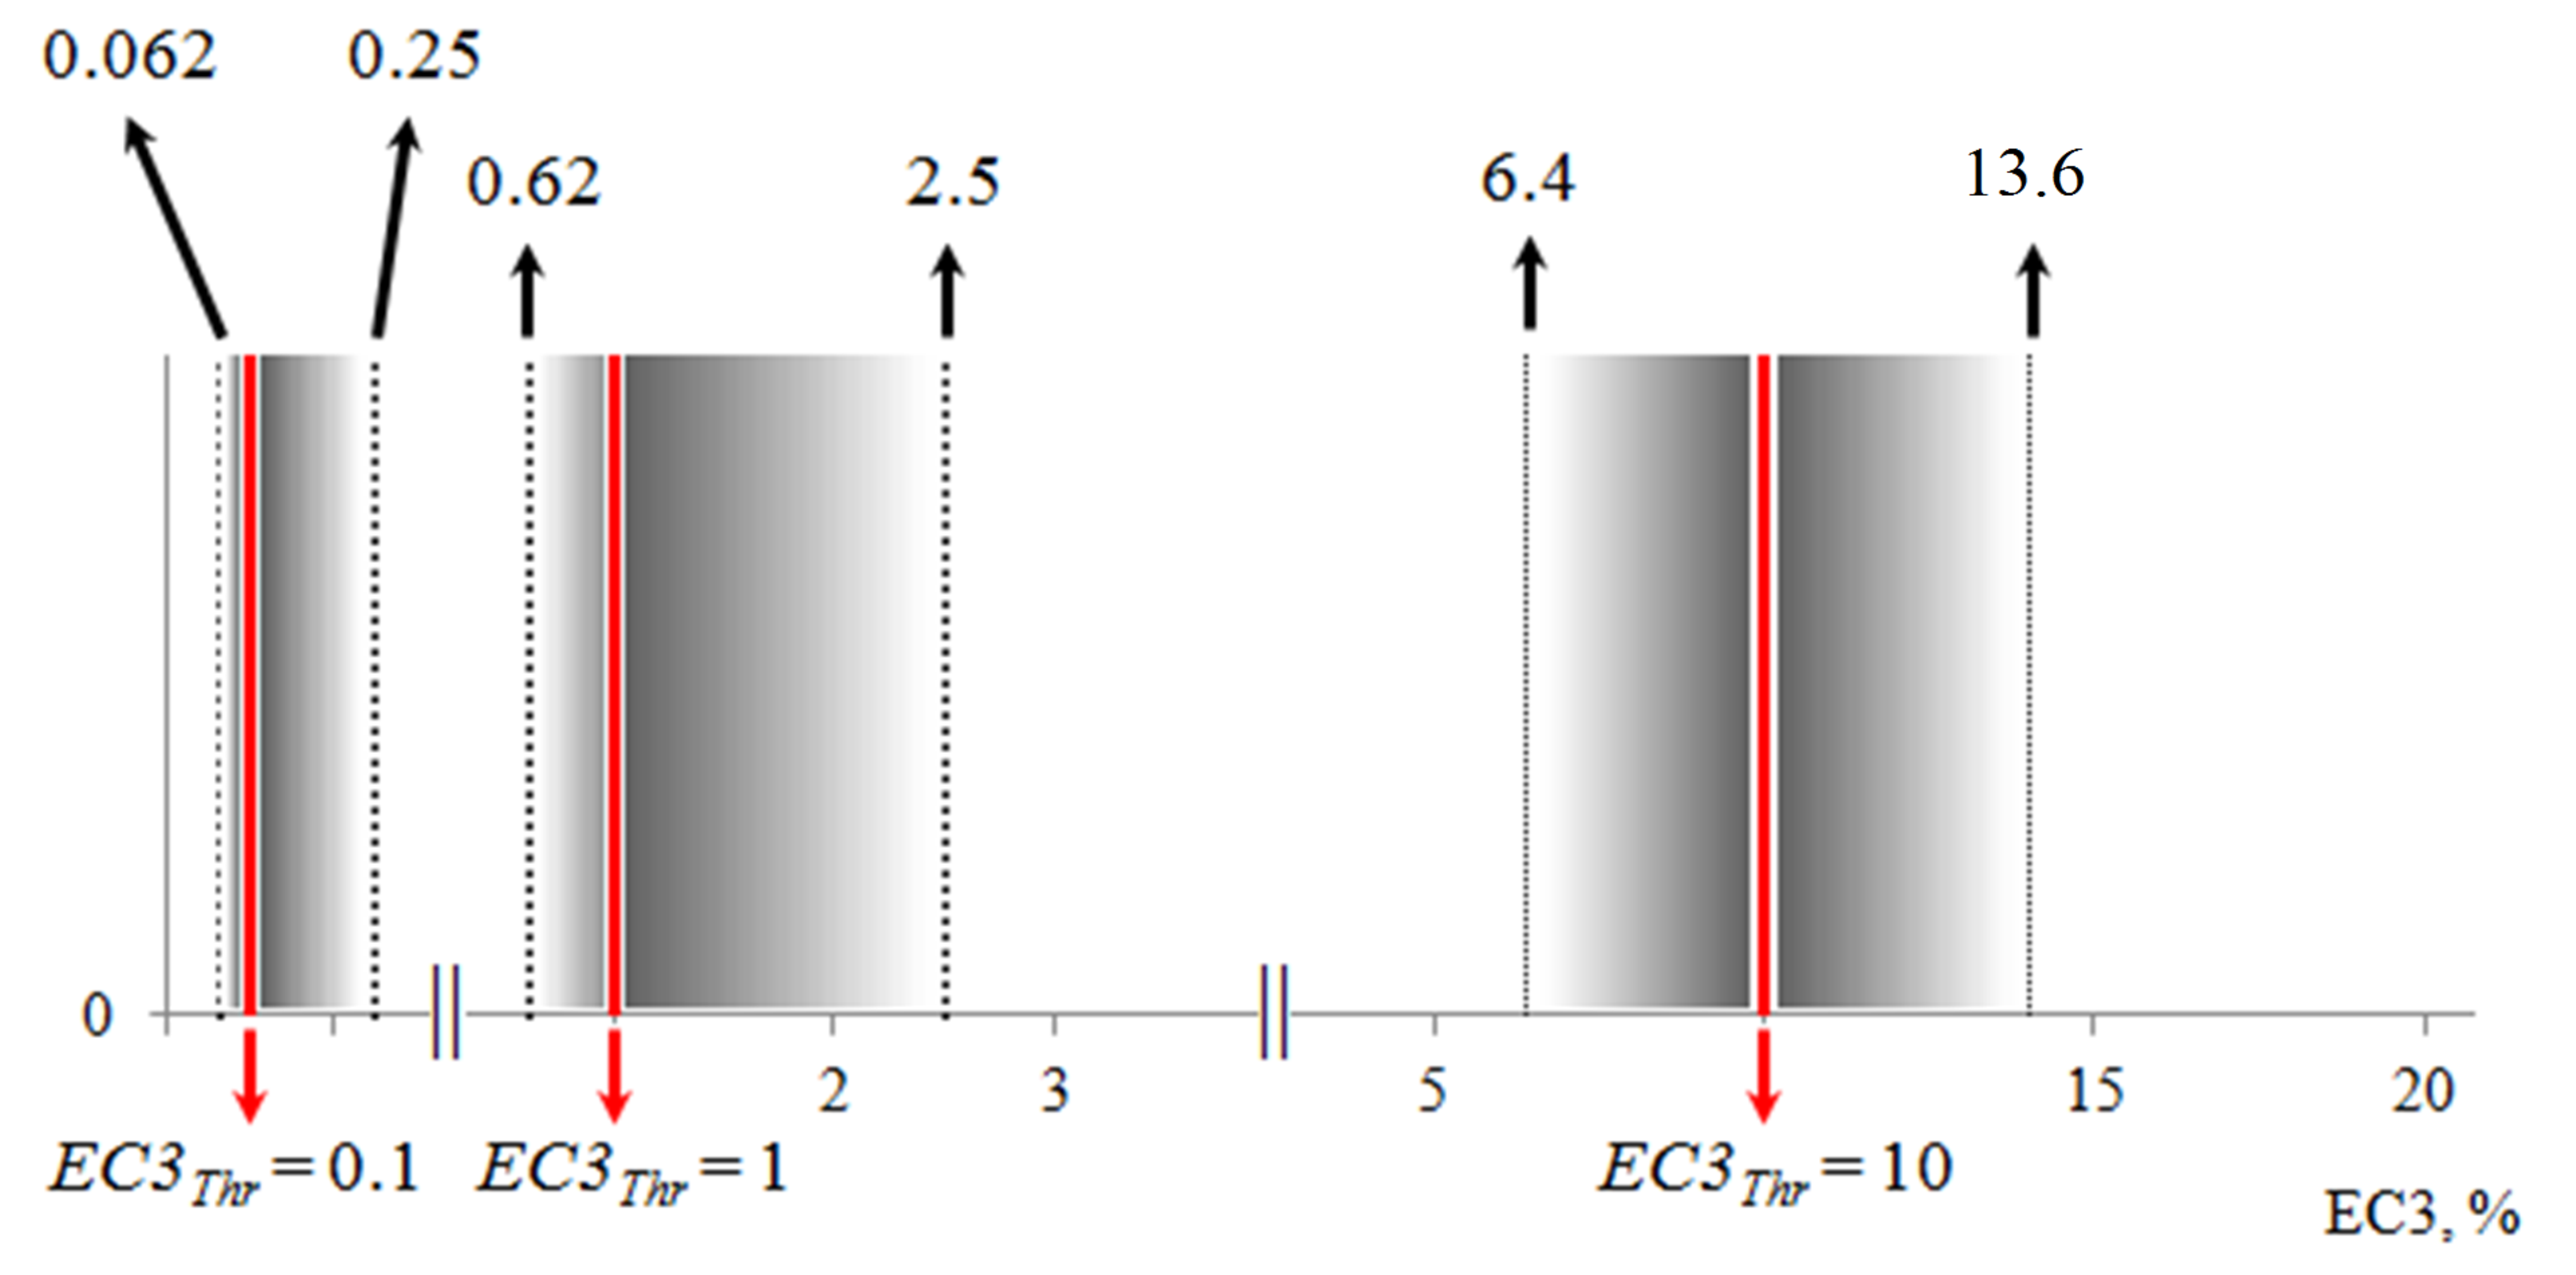
Figure 2. "Gray zones" for the EC3 thresholds according to the classification scheme suggested by Kimber et al.
As can be seen with increasing EC3 threshold the gray zone is
becoming larger. At EC3 threshold of 10% that discriminates strong
from weak sensitizers in TIMES SS model the gray zone is from 6.4
to 13.6. When the EC3 value of a chemical falls within this gray
zone its classification as weak sensitizer is questionable. At the
EC3 threshold of 50%, discriminating weak from non-sensitizers in
TIMES SS model, the gray zone is significantly larger and difficult
to define due to the lack of data.
The above analysis clearly explains the low performance of the
model for weak sensitizers which correspond to large variation of
experimental error at this range.
Fuzziness of the weak/non threshold. Initially the weak/non boundary in TIMES SS model was EC3 = 100% meeting the regulatory requirements. Later on, due to the low accuracy of experimental data at high EC3 values it was decided the threshold discriminating weak from non-sensitizers to be 50%. After this threshold the mechanisms and skin sensitization effects were smearing out.
Reporting
The predictions from Skin sensitization model could be reported as a tab delimited text file or (Q)SAR Predicting Reporting Format (QPRF) providing the following information for the parent chemicals and their metabolites: chemical identity (CAS number, Name, SMILES), quantity, skin sensitization effect, applicability domain, reliability of simulated metabolism, etc.
References
1. S. Dimitrov, L. Low, G. Patlewicz, P.
Kern, G. Dimitrova, M. Comber, R. Philips, J. Niemela, P. Bailey,
O. Mekenyan, Skin sensitization: modeling based on skin metabolism
simulation and formation of protein conjugates, International
Journal of Toxicology, 24:189-204, (2005).
2. G. Patlewicz, S. Dimitrov, L. Low, P.
Kern, G. Dimitrova, M. Comber, A. Aptula, R. Phillips, J. Niemela,
C. Madsen, E. Wedebye, D. Roberts, P. Bailey, O. Mekenyan. TIMES-SS
- A promising tool for the assessment of skin sensitization hazard.
A characterization with respect to the OECD validation principles
for (Q)SARs and an external evaluation for predictivity, Regulator
Toxicology and Pharmacology, 48, 225-239, (2007).
3. D.A. Basketter, E.W. Scholes and I.
Kimber, The performance of the local lymph node assay with
chemicals identified as contact allergens in the human maximization
test, Food Chem. Toxicol. 32 (1994), pp. 543-547.
4. B. Magnusson and A.M. Kligman, The
identification of contact allergens by animal assay. The guinea pig
maximization test, J. Investig. Dermatol. 52 (1969), pp.
268-276.
5. B. Magnusson and A.M. Kligman, Allergic
contact dermatitis in the guinea pig, Identification of contact
allergens, Ch. A. Thomas ed., Springfield, IL, 1970.
6. D. Kayser and E. Schlede (eds.)
Chemikalien und Kontagtalergie - eine bewertende Zusammenstellung,
Medizin&Wissen Verlagges, Munchen. ISBN 3-86094-163-1,
2001.
7. E. Schlede, W. Aberer, T. Fuchs, I.
Gerner, H. Lessmann, T. Maurer, R. Rossbacher, G. Stropp, E. Wagner
and D. Kayser, Chemical substances and contact allergy-244
substances ranked according to allergenic potency, Toxicol. 193
(2003), pp. 219-259.
8. ECETOC [European Centre for
Ecotoxicology and Toxicology of Chemicals], Contact Sensitization:
Classification According to Potency, Tech. Rep. No. 87, 4 Avenue E.
Van Nieuwenhuyse (Bte 6), B-1160 Brussels, Belgium, 2003.
9. M.D. Barratt, D.A. Basketter, M.
Chamberlain, G.D. Admans and J.J. Langowski, An expert system
rulebase for identifying contact allergens, Toxicol. in Vitro 8
(1994), pp.1053-1060.
10. O. Mekenyan, N. Nikolova, P. Schmieder
and G. Veith, COREPA-M: A multi-dimentional formulation of COREPA,
QSAR Comb. Sci. 23 (1) (2004), pp. 5-18.
11. S. Dimitrov, G. Dimitrova, T. Pavlov, N.
Dimitrova, G. Patlevisz, J. Niemela and O. Mekemyan, J. Chem. Inf.
Model. 45 (2005), pp. 839-849.
12. S. Dimitrov, A. Detroyer, C. Piroird,
C. Gomes, J. Eilstein, T. Pauloin, C. Kuseva, H. Ivanova, I.
Popova, Y. Karakolev, S. Ringeissen and O. Mekenyan, J. Appl.
Toxicol. (2016), pp.
13. I. Kimber, J. Hilton, RJ. Dearman, GF.
Gerberick, CA. Ryan, DA. Basketter, EW. Scholes, GS. Ladics, SE,
Loveless, RV. House, A. Guy, Toxicology 103 (1995), pp.
63-73.
Skin sensitization
Pro-electrophilic activation
Click the image for a larger view

Model description pdf